As publishers grow skeptical of their programmatic revenue (increased privacy regulation, crumbling of third party cookies, mis-alignment of incentives along the value-chain, etc), a lot of them now prefer direct monetization over programmatic channels. As this happens, it is important for publishers to understand what are some of the things that advertisers look for when running ad campaigns directly with a publisher. This will help publishers focus on improving these key metrics (campaign goals or KPIs) which in turn improves the campaigns’ efficiency and brings in more budgets with better CPMs.
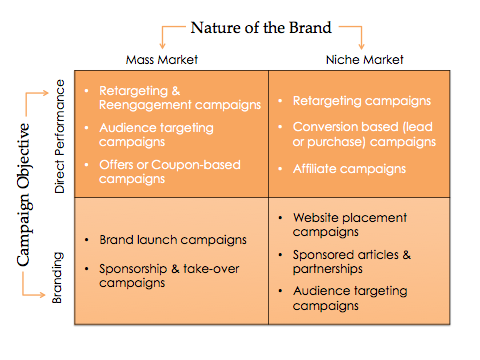
The kind of display campaign that an advertiser will run depends on the nature of the brand and the goal of the campaign. There are broadly two kinds of brands – mass market vs niche market and two goals of a display campaign – direct performance vs branding. The below 2×2 matrix shows the kind of campaigns that are run in each of these scenarios. Please note that this is just an indicative of the general trend and every marketer will have her own unique approach to running these campaigns.
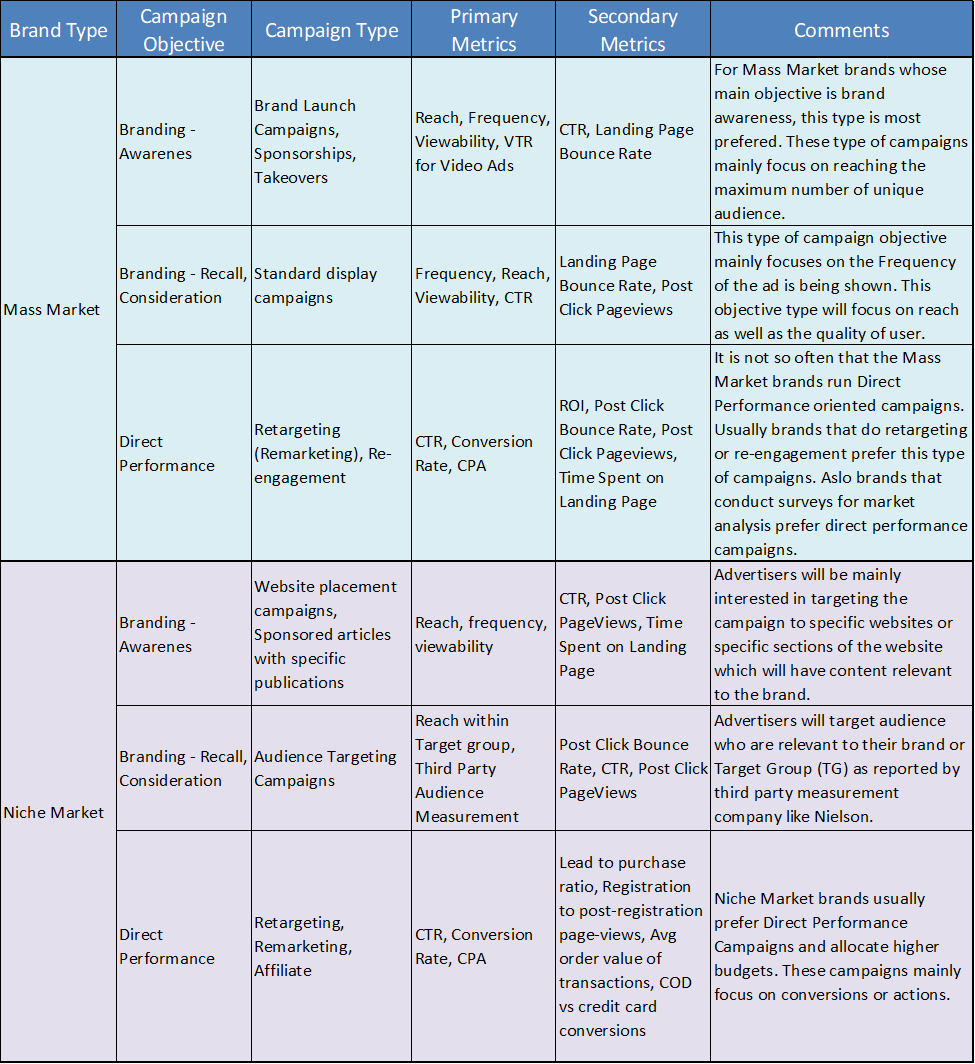
Below is a table that gives more information about the metrics that are important for different campaign & brand types.
Now that we understand the different types of campaigns & corresponding metrics tracked, let’s ensure that we have an accurate understanding of what each of these metrics mean. Below is a glossary of all the metrics we spoke about and their corresponding definitions or how exactly they are measured.
Some of these metrics are as follows.
-
CTR: One of the most basic and important metrics of all is CTR or Click through Rate. CTR is defined as the number of clicks received per 100 impressions. This metric is important because it indicates quality of users, level of engagement & impacts the eventual ROI of a campaign. Hence better the CTR, better the efficiency of a campaign. Now for the same audience, different campaigns may yield different CTRs. So it’s really important for a publisher to choose the right inventory or pagetype for the right campaign so that it gets maximum CTR.
This metric is reported in Ad Manager as ‘Total CTR’ and can also be calculated manually using the formula: CTR = (clicks/impressions)*100
-
Viewability: To get a click on an ad, the ad must be visible to the user and the measure of whether an ad is visible or not is called Viewability. Google Ad Manager reports this metric under the name ‘Active View % viewable impressions’. According to IAB measurement standards, an ad is counted as viewable if at least 50% of its area was displayed on screen for at least one second. For video ads, the viewability standard is different, the ad must have at least had 50% visibility on screen, and must have been viewable for at least 2 seconds. Hence it is important to choose the correct ad-units to get better outcome from the campaign because good viewability yields better CTR and better CTR yields better interaction and better conversions.
Viewability is a very important metric for almost all types of campaigns. In fact there is increasing demand for better viewability from advertisers for the past few years. Several studies also have shown that higher viewability yields better performance. Hence focusing on improving the viewability of a campaign is important for publishers.
Viewability can be calculated using the formula:
Viewabilty (%) = (Total Viewable Impressions/Total Measurable impressions or Total Impressions)*100 -
VTR: VTR or View Through Rate is the percentage of people who saw the complete ad out of all the users who loaded the ad on their devices. VTR is mainly applicable to video ads and flash ads where a skip option is available. VTR is also known as Video Completion Rate.
VTR can be calculated using the following formula:
VTR = Complete views (user did not skip) / Impressions (ad rendered)VTR is not directly reported in ad manager but can be calculated using the above formula as ad manager provides total number of complete views as well as total number of impressions.
-
Reach: Reach of a campaign is the total number of unique users reached by the campaign.
This is a very important metric for several campaign types as described above. Reach is reported in the premium version of Google Ad Manager (Google Ad Manager 360) under report type = Reach. For Publishers who don’t have ad manager 360, Tercept tracks & generates campaign reach reports by firing an impression beacon on the user’s browser as soon as the campaign’s ad is rendered.
-
Frequency: Frequency is the number of times an ad is being shown to a user. Most branding campaigns track the frequency of their ad being shown. But frequency is a very sensitive metric that publishers need to be careful of because there is a risk of frequency being too low or too high. If the frequency is too low, such as only 1 impression per user, then there can be a risk of losing out on a conversion from that user or creating an impact on the user – if, for some reason, that the user is in a hurry or maybe she would have clicked had the ad been shown again. Similarly if the frequency is too high, such as 10 or more impressions per hour, then the user may develop ad blindness or may get annoyed by the same ad and never click on the ad.
Publishers can limit the number of ads shown to users via their line-item settings and get the average number of impressions per user by dividing the total number of impressions by unique users who have seen the ad. Through Tercept, publishers can have unprecedented control on impression frequency by controlling it across users, campaigns, geos, ad-units, devices, website-sections as well as UTM sources.
-
Conversion Rate: Conversion rate is the ratio of total number of users who take a desired action (a.k.a conversion) by the total number of users who visit the landing page from that campaign.
Conversion rate is the most important metric for campaigns that are trying to accelerate growth and market share and campaigns that collect leads.
Conversion rate is also obtained by Publishers using a tracking pixel on the conversion page.
Conversion Rate = (Total Conversions / Total users landed on landing page) *100 -
Click to Conversion Rate: As name suggests, click to conversion rate is the ratio of conversions to clicks (rather than landing page visits). This is very similar to conversion rate except that some clicks bounce even before the user lands on the landing page.
This is also an important metric for campaigns that are focused on direct performance.
This can be calculated using the formula:
CCR = (Clicks/Conversions)*100 -
Post click page views: Post click pageviews is the total number of pages a user sees after clicking on an ad and going to the landing page. This indicates the interaction of the user and gives us a hint about his/her interest levels.
This metric is useful for campaign types which are trying to accelerate growth, influence buying decisions, educate consumers as well as retrieve lost sales.
-
Landing page bounce rate: Landing page bounce rate is the ratio of the number of users who leave after a single session on your website by the total number of users that land on the page from a campaign. For example, if 100 people land on the landing page from the campaign and 50 people leave before visiting a second page, then the bounce rate is 50%.
-
CPA: CPA or Cost Per Action is a metric used to measure the cost advertisers incurring to get the desired action. It can also be called cost per conversion. This is a very important metric for advertisers to calculate and optimize their Return On Investment (ROI). So it is important for both the advertisers and the publishers to make CPA more efficient so that publishers can get more budgets and advertisers can make sure they are spending on the right audience segments.This is a very important metric for brands that are looking for direct performance.
-
View through conversions: A View-through conversion is counted when a user completes a conversion within 30 days of your ad campaign after viewing the ads but not necessarily clicking on them.
This is important for campaigns that are looking for conversions, influence buying decisions and retrieve lost sales (cart abandonment).For advertisers, this metric is reported in Google AdWords as ‘View-through conv.’ Publishers can track this data using a tracking pixel on the conversion page.
-
Third Party Audience Measurement: Third party audience tracking like ‘Nielsen Audience Segments’, provides marketers with measured consumer data to reach their desired online audiences more effectively and efficiently. They collect data of user’s behaviours from various sources and then map it to digital identifiers to create verified digital audiences.Advertisers can use such audience segmentation to measure the effectiveness of a campaign as well as to narrow down their targeting criteria to a more relevant and considerable user base. These segments are mainly used by niche market brands whose objective is to achieve brand recall, awareness & consideration.
Some of the above metrics may not be available directly in Google Ad Manager or any other ad servers but can be derived from combining ad manager and Google Analytics metrics. Google Ad Manager provides little flexibility on improving these metrics. But with the available options that Google Ad Manager provides, publishers can try to improve these metrics by taking data driven decisions such as choosing the right inventory / ad units, ad size, device category, AMP and non-AMP pages, page category, impression frequency cap, first impression of the day, number of impressions per page, location of the user etc.
There is a lot more that a publisher can do beyond what Google Ad Manager provides and can give spectacular results. At Tercept, we have tried and tested methods that we are applying and improvising from the past couple of years delivering 2-3x improvement in all the above metrics through AI driven campaign optimisation.
Author
Vinay B Rao
Lead Analyst, Tercept

0 Comments Leave a comment