Analytical reporting uses qualitative and quantitative data to enable strategists to make data driven decisions based on evidence and analytics. These decisions impact a company for better or worse. Here are 5 features you cannot do without for Analytical Reporting:
-
Visualize your data to understand trends and see dips: Visual summary of information makes it easier to look for patterns and trends than looking through thousands of rows on a spreadsheet. This also helps when employees want to put across a point to seniors whose opinion matters the most. On top of this who doesn’t prefer to look at pie charts and understand the spread in revenue across sectors over a static table? In Tercept Dashboard we have a wide array of data visualizing options available.
-
Get notified whenever there are abnormalities in numbers: Threshold alerts are life savers when you have metrics that are bread & butter for you. Steady Ad revenues or impressions to your websites need not be monitored 24/7, set alerts whenever they fall below threshold. You can manually set your ranges and get notified via Email, SMS or slack whenever abnormalities are seen. Also get hourly alerts on metrics you want to keep a constant eye on. You can now stop worrying about your numbers and focus on increasing them.
-
Schedule a report to see them at regular intervals: Let’s assume you have a meeting first thing in the morning, and you have to present your latest data to your management or you are on a go but want a daily report to keep in check with the numbers. Worry no more because if you are using Tercept Unified Analytics you can set yourself a scheduled report that automatically mails you with the latest data. Smaller sized reports present data in the email itself so no hazzle of downloading attachments and skim through your important metrics right away.
-
Save queries that you run most regularly: Save your most regularly used queries within the Tercept Dashboard. Campaign performances, Ad Unit, header bidding performances that you usually keep monitoring can be saved as queries, so that you never will have to set your dimensions or your metrics again. Do less of annoying work and more of productive ones!
-
Download your query: You can now download your query in different formats from Tercept Dashboard to view it in excel or share it with colleagues. You can also share reports & queries your fellow employees by mailing it to them directly from the Tercept UI.
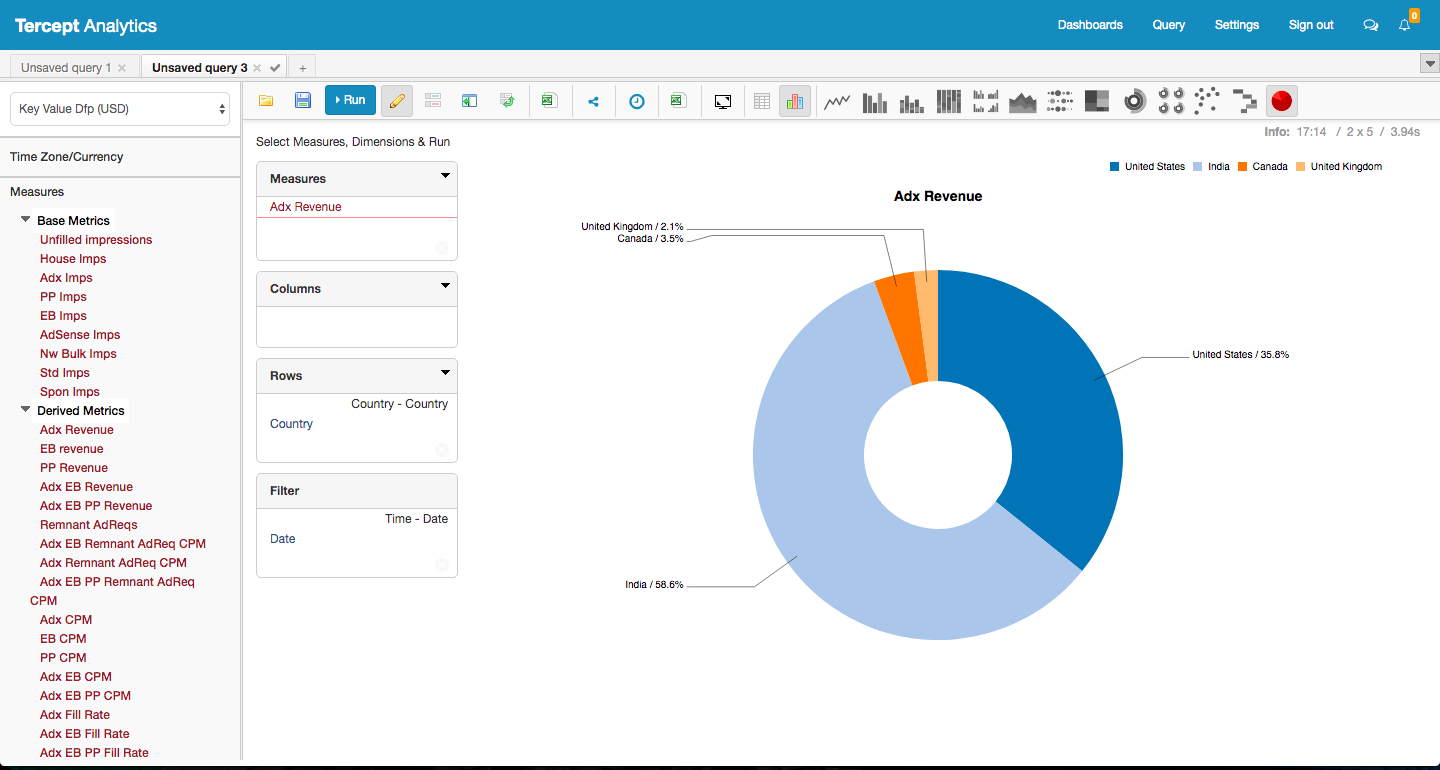 Adx Revenue Distribution for Top Countries using Pie Chart
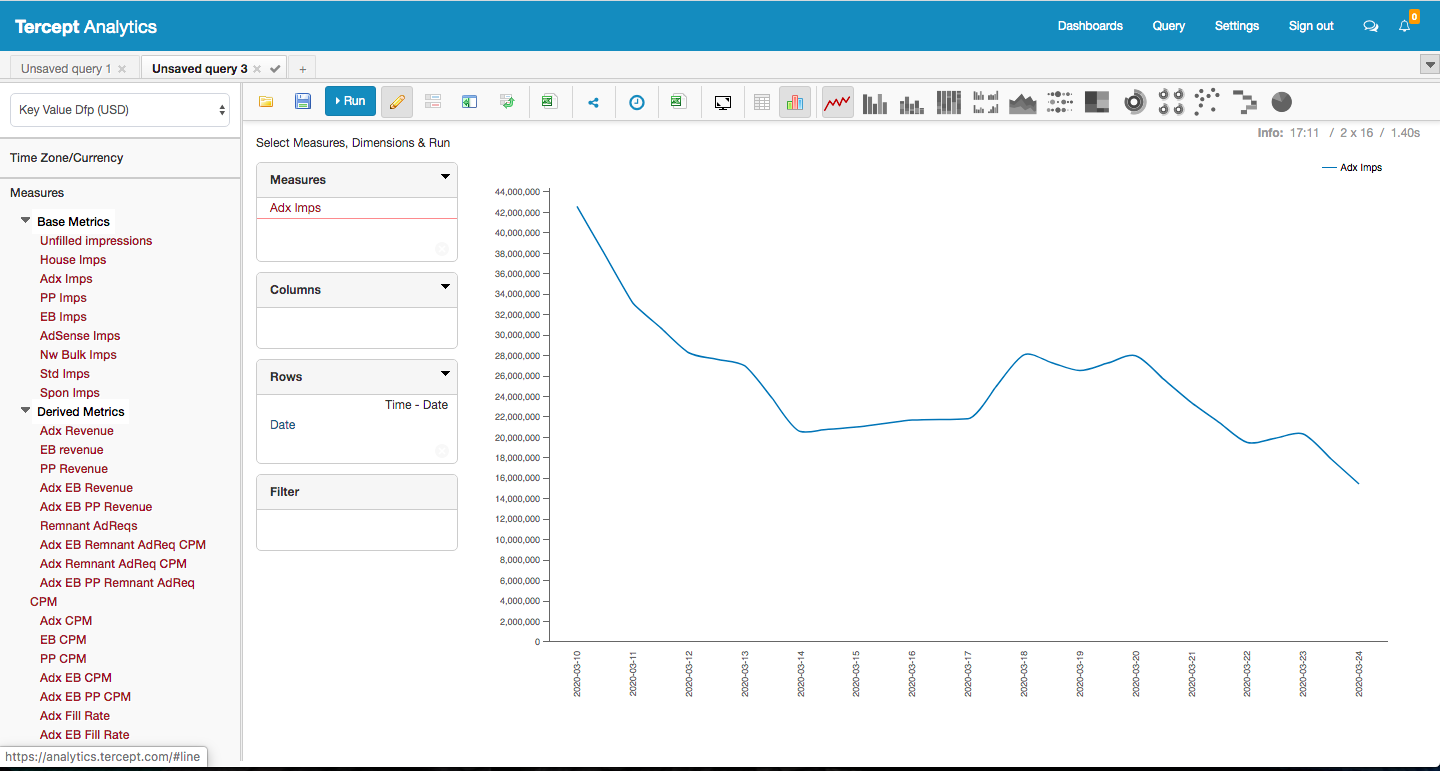 Line Graph showing daily trends of Adx Impressions
Author
Tejas Potti
Business Analyst, Tercept

0 Comments Leave a comment