Viewability has fast become one of the most important metrics for advertisers and over the years, there have been several studies showing that on average, 50% of all impressions are not seen at all by users; which means that advertisers are paying for impressions that are not seen by anybody. This has sparked off a trend where advertisers are inclined towards paying for viewable impressions instead of served impressions.
It is time for Publishers to consider viewability as one of the important metrics which cannot be ignored and figure out strategies to continuously improve the viewability of their inventory as well as the boost viewability of the campaigns they run on behalf of brands.
So what are viewable impressions? According to IAB standards, for an ad to be called ‘viewable’, at least 50% of the ad or creative should be visible on the screen for at least 1 second. There are a lot of factors that influence viewability such as ad size, ad location, internet connection speed, page category or vertical, device category, user behaviour etc. And as we can expect, above the fold and vertical banners such as 160×600 has higher viewability compared to other ad locations or sizes. But putting a 160×600 banner above the fold may not always give you a 100% viewability because there are a lot of other factors that influence viewability.
To increase the viewability of ad campaigns, publishers may take several steps at various levels:
1. Page level/placement level
2. Line item targeting level and
3. User behavior level
On the page level where Publishers can take smart decisions on ad placements, to put their ad slots where they can get the maximum viewability. For example according to Google, an ad placed right above the fold fetches maximum viewability than placing it on top of the page! (https://www.support.google.com/admanager/answer/6199883?hl=en&ref_topic=7506202)
Similarly, publishers can take several data driven steps on where to place their ad and what their size should be that suits their page type and domain so that it fetches maximum viewability. Publishers can also optimize their page load time for better viewability of their ads. In a recent study by Google, mobile sites that loaded faster were observed to have 25% better viewability. (https://www.support.google.com/admanager/answer/6199883?hl=en&ref_topic=7506202).
Also we have observed that AMP ad units have better viewability than their non-AMP counterparts as AMP pages load faster.


Once the page layouts are in place to get the maximum possible viewability, publishers can use their line item settings in Google ad manager that allows targeting of Ad Units, Geography, Device Category, Devices, Browser, Operating System etc. For example, viewability may be different for different Operating Systems as older versions of Operating Systems most probably run on Smartphones with a smaller screen size. So publishers can target latest versions of OS in their line item to increase the viewability of the campaign. But the options are limited here as Publishers have to depend on Google Ad Manager’s targeting and once the variables GAM provides are exhausted, there is very little Publishers can do from there to optimize their viewability.
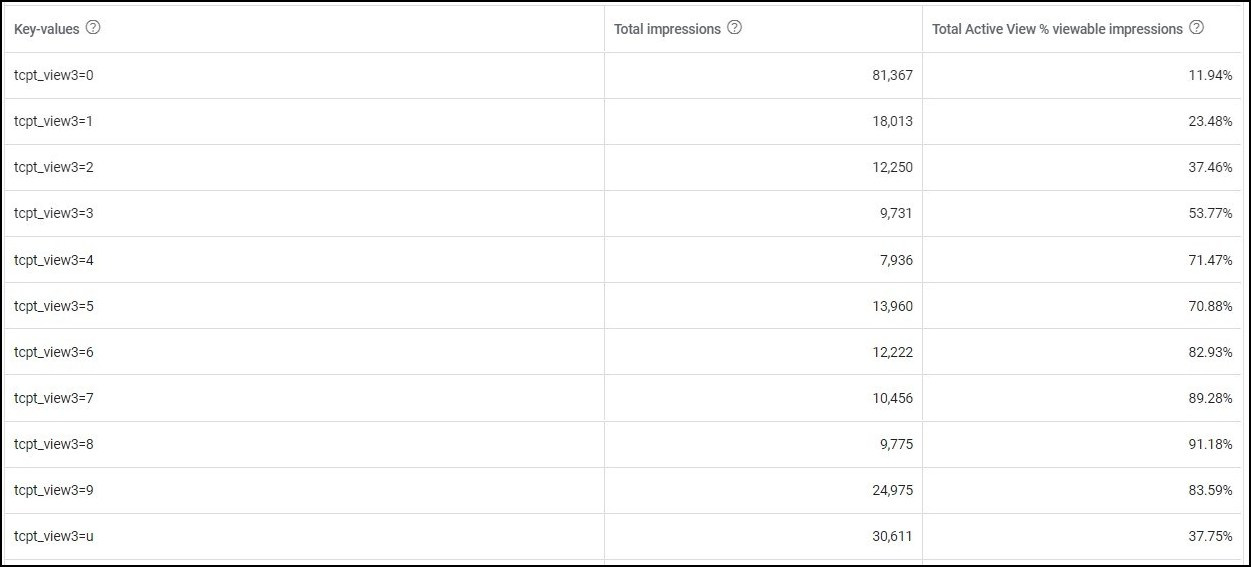
But is this the maximum viewability you can optimize for your campaigns? To find out the same, we started making a list of user behavior variables & highly granular contextual variables that we thought would have a big impact on viewability. Such as loyalty of the user, number of visits, number of ads seen in a day, number of ads present on the page, time of the day, source of the user, key-words on the page, zip code, device make/model, etc. and fed these variables along with many other such variables to build a machine learning driven user/ad-request scoring algorithm that can accurately predict the viewability of every single ad-request in real-time. The model scores users on a scale of 0 to 9 with 0 being the lowest predicted viewability and 9 being the highest predicted viewability. Then we populate these values in ad manager key-values so that they can be targeted in line items. We have tried different algorithms and variables and started populating them with different keys, such as tcpt_view1, tcpt_view2, tcpt_view3 etc (as shown in the below example) and based on the results of each key-value, we fine tune our algorithm to increase efficiency and predictability. The results have been highly impressive to say the least. When we run a report against a campaign, we get user or ad-request viewabilities ranging from as low as 10% to as high as 90% where as the total average viewability of this line item would be something like 40-50%.
Here, in the line item shown below, if we target higher scores in the line item such as tcpt_view3=7,8 and 9 the average viewability of the line item would jump 2x to ~88% from 42%.

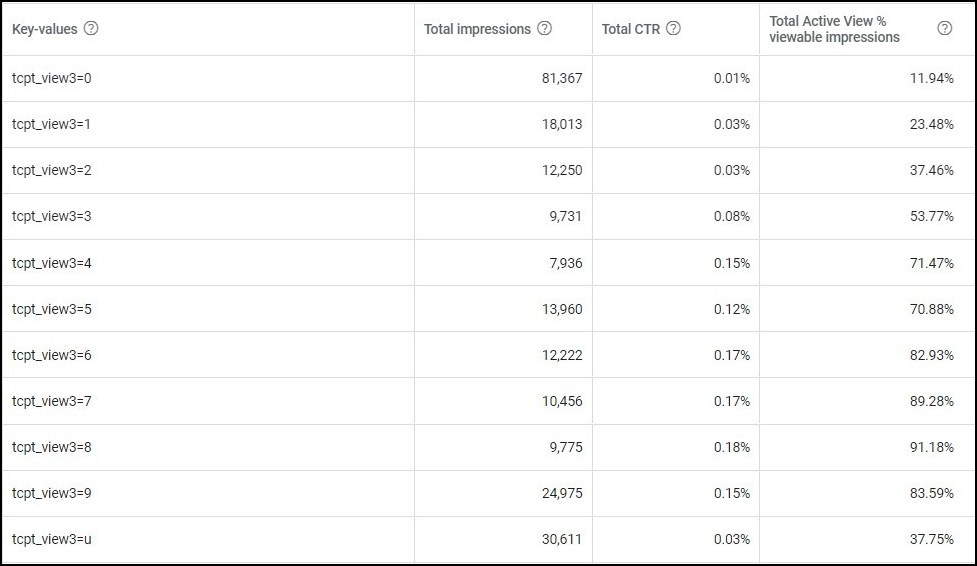
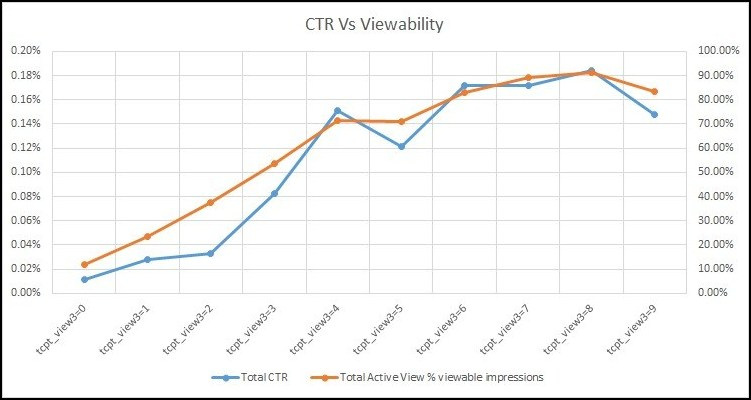
Also, we started thinking about what effect viewability may have on other metrics such as Click through Rate, Conversion Rates etc, because they are logically inter-linked. High viewability means the probability of a user seeing an ad is high and hence increases the user’s probability of clicking an ad. For most of the campaigns, for those buckets where viewability was high, CTR was also better and vice versa. When we were doing CTR optimization, we had observed that viewability was also boosted. We can see this behavior in the above mentioned example after I include CTR in the report.

We can see that the higher viewability scores show better viewability measurement as well as better campaign CTRs.

Though this may not be the case always, we observed a strong correlation between viewability and CTR.
We tried different variables and algorithms over a period of time to increase the accuracy of our prediction and we still feel there are a lot of variables which we may not have considered yet but have a significant effect on viewability.
So the third method can be a game changer once you have optimized your viewability on page level and line item targeting level. So next time when you think your line item is fully optimized for viewability, Think again!
Author
Vinay B Rao
Lead Analyst, Tercept

0 Comments Leave a comment